
Economic effects of the Government's response
The Government moved quickly to support households, workers and businesses through the pandemic. The positive economic impact of our action has been significant.
The Victorian economy has well and truly bounced back: it’s strong, it’s growing, and it’s delivering record-breaking jobs performance.
Economic activity is above pre-pandemic levels, and the labour market is even stronger than it was before the pandemic. Economic output per person is expected to be 5% higher in 2022-23 than it was in 2018-19, the last full year before the pandemic. The rate of unemployment is around its lowest level since the early 1970s, underemployment is around a multi-decade low and the participation rate of 67.7% at March 2023 is at a record high.
The economy is expected to remain healthy in 2022-23, with real economic growth of 2.75%. This follows growth of 5.6% in 2021-22, which was the highest of all the states and well above national growth.
Employment for those most affected by the pandemic, especially women and young people, recovered strongly. By early 2022 female employment had grown more than male employment, compared with March 2020 levels. Meanwhile, the proportion of young people in employment recovered to around pre-pandemic levels by early 2022.
Our economy is forecast to keep growing and creating jobs, even while weathering the current global challenges of high inflation and rising interest rates. Real GSP growth is expected to slow to 1.5% in 2023-24, although unemployment is expected to remain low. In following years, economic growth is expected to strengthen as inflation eases and interest rates decline.
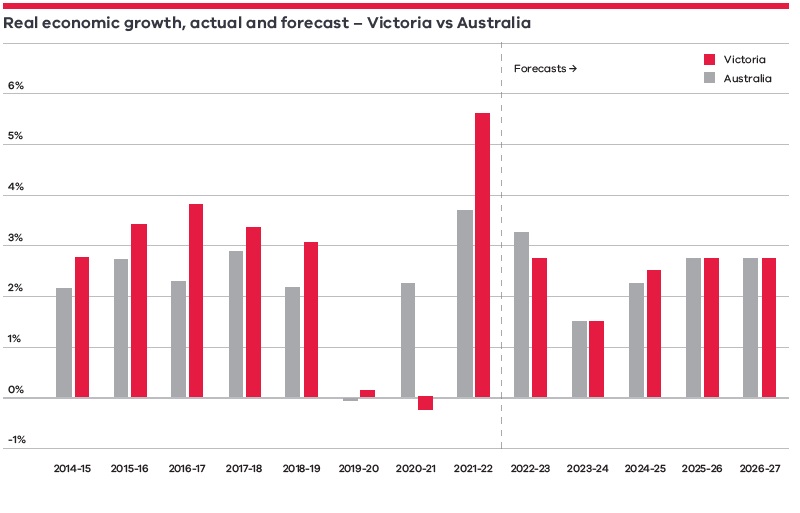
Sources: Australian Bureau of Statistics; Commonwealth Treasury; Department of Treasury and Finance.
Key elements of our Jobs Plan
Victorians at work – getting Victorians back to work.
Building opportunity – building our state as we rebuild our economy.
Supporting industry and growth – support for industries and leveraging our strengths.
Supporting every corner of our state – ensuring no community and no Victorian is left behind.
Success of the Government's Jobs Plan
A decent job is worth more than just a pay cheque. It’s about creating security, dignity and certainty for you and the people you love the most. We knew that as we started to rebuild from the pandemic, we needed to support Victorians to train, retrain and find new opportunities.
We needed to help those hardest hit by the pandemic to find work – ensuring not only a job, but certainty and security. And we needed to make sure we were creating strong, secure and decent jobs for the future – and for our future generations.
Our Jobs Plan, announced in the Victorian Budget 2020/21, was our strategy to protect the economy and create jobs – putting job creation at the heart of our economic recovery.
The Jobs Plan was also designed to provide the greatest level of support to the Victorian labour market at the time when it was needed most, while support from the Commonwealth Government dropped off.
Our record investments during the pandemic delivered the jobs we needed in the short term, and they’re supporting our growing state into the future. As part of our Jobs Plan, we:
- Launched the $6 billion Big Housing Build – including $5.3 billion to build more than 12,000 new social and affordable homes, and $678 million to make housing more accessible and affordable for Victorians, supporting thousands of jobs.
- Invested $1.9 billion to upgrade 162 schools, building one new school and four additional stages at recently built schools.
- Introduced a transformational $1.6 billion investment to improve energy efficiency in Victorian homes and accelerate clean energy investment, while supporting thousands of new Victorian jobs.
- Invested $1.6 billion to transform our city’s Arts Precinct – attracting visitors from interstate and overseas, supporting local jobs and giving everyone a new public place to enjoy and explore.
- Provided $1.1 billion in cash grants to support small and medium-sized businesses, including $822 million for the third round of the Business Support Fund, $251 million for a dedicated Licenced Venue Fund, and $44 million to equip businesses to thrive in post-pandemic conditions.
- Provided $1 billion in TAFE and training to give Victorians the skills to get back to work.
- Provided just under $1 billion for the New jobs tax credit to encourage small and medium businesses to increase employment by re-hiring staff, restoring staff hours or supporting new jobs as they recovered from the effects of the pandemic.
- Provided $626 million for the Digital Future Now package to remove more blackspots, digitally connect regional communities and allowing unemployed Victorians to undertake digital skills training or take part in a digital internship.
- Provided a $619 million investment in Jobs for Victoria services to help Victorians into work.
- Established a $465 million Victorian Tourism Recovery Package to support and restart the sector.
- Invested $235 million to build our Recovery Workforce to create jobs across mental health, family violence, health and child protection.
- Funded $156 million for local priorities, businesses and recovery investment for our regions.
In guiding Victoria’s recovery, the Jobs Plan played to our strengths, advancing opportunities for growth in new innovative industries, and fundamentally, getting more Victorians back into work.
Achieving our Jobs Plan
Our Jobs Plan had a target to create 400,000 new jobs by 2025.
We’ve met our Jobs Plan target more than two years early, with almost 440,000 jobs created since the trough in employment in September 2020. The total number of Victorians with a job has increased to more than 3.6 million.
Underpinning it all – a strong economy that works for working people.
Leveraging our balance sheet
Our approach during the pandemic was to protect Victorians and to prevent a long-term economic downturn.
What we did in Victoria was undertaken by governments right across the globe, reinforced by institutions like the International Monetary Fund.
Inevitably, this approach led to a necessary increase in operating deficits as we borrowed to protect Victorians, and our economy.
Our net operating deficits followed a similar trend to the Commonwealth and New South Wales governments, with broadly comparable levels as a proportion of state and national economies.
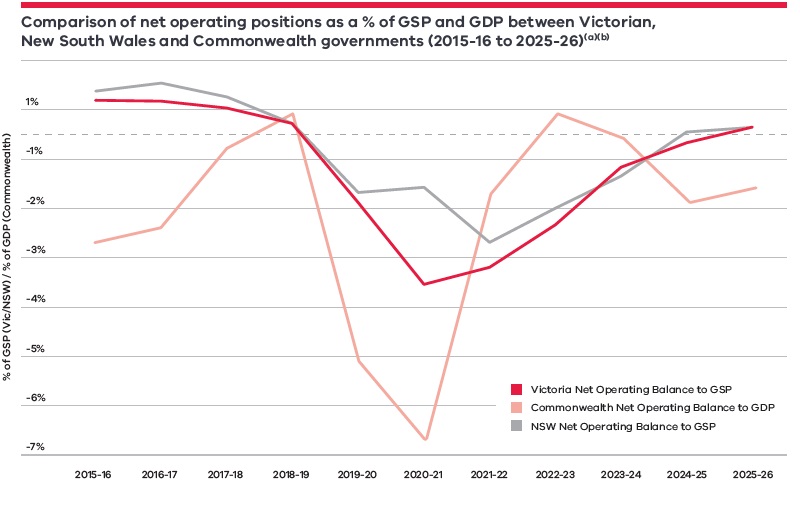
Source: Department of Treasury and Finance. Commonwealth 2023-24 Budget and NSW 2022-23 Mid-Year Budget.
Notes:
(a) 2015-16 to 2021-22 represent actual net operating positions as a proportion of GSP or GDP.
(b) GSP refers to gross state product. GDP refers to gross domestic product.
A four-step fiscal strategy
At the start of the pandemic, we set out a responsible and clear four-step fiscal strategy to restore the state’s finances over the medium term. This strategy not only improves the state’s financial position, but also helps guard against future financial shocks.
This strategy involves:
- Step one: Creating jobs, reducing unemployment and restoring economic growth.
- Step two: Returning to an operating cash surplus.
- Step three: Returning to operating surpluses.
- Step four: Stabilising debt levels.
Our plan is working. We’ve kept working to create the jobs that underpin our state’s economic growth, while returning to operating cash surpluses and operating surpluses.
And in this Budget, we’re taking the targeted and responsible actions we need to, so we can achieve step four in the medium term. All of this means we can keep investing in health, education and infrastructure – while also managing our finances responsibly.
We’ve invested $1.5 billion in early interventions to change the trajectory of people’s lives, with decisions over three budgets generating at least $1.8 billion of benefits over the next decade. Benefits include avoided costs from state services, higher labour productivity, lower welfare payments and less out-of-pocket health costs to those needing care.
Further improvement in the state’s fiscal aggregates in the 2023/24 Victorian Budget
- Our net cash flows from operating activities is forecast to be $1.2 billion greater or 23% higher in 2025-26 compared to the Pre-Election Budget Update (PEBU).
- Our operating result is expected to be in surplus by $1.2 billion in 2026-27 – representing an improvement of $15 billion in the operating result since 2021-22.
- Net debt will reduce by $3.7 billion in 2025-26, compared to the same year in PEBU.
- The Victorian Budget 2020/21 forecast net debt to hit 28.9% by 2023-24, compared to 22.6% outlined in this budget, rising only to 24.5% by 2026-27.
General government fiscal aggregates
| Unit of measure | 2021/22 actual | 2022/23 revised | 2023/24 budget | 2024/25 estimate | 2025/26 estimate | 2026/27 estimate | |
|---|---|---|---|---|---|---|---|
| Net result from transactions | $ billion | (13.8) | (10.3) | (4.0) | (1.1) | 1.0 | 1.2 |
| Net cash flows from operating activities | $ billion | (8.9) | 2.9 | 0.8 | 4.3 | 6.5 | 6.5 |
| Government infrastructure investment (a) (b) | $ billion | 18.7 | 22.5 | 22.4 | 20.6 | 18.6 | 16.9 |
| Net debt | $ billion | 100.0 | 116.7 | 135.4 | 151.2 | 162.2 | 171.4 |
| Net debt to GSP (c) | per cent | 19.4 | 20.6 | 22.6 | 23.9 | 24.4 | 24.5 |
- Net result from transactions
- Unit of measure
- $ billion
- 2021/22 actual
- (13.8)
- 2022/23 revised
- (10.3)
- 2023/24 budget
- (4.0)
- 2024/25 estimate
- (1.1)
- 2025/26 estimate
- 1.0
- 2026/27 estimate
- 1.2
- Net cash flows from operating activities
- Unit of measure
- $ billion
- 2021/22 actual
- (8.9)
- 2022/23 revised
- 2.9
- 2023/24 budget
- 0.8
- 2024/25 estimate
- 4.3
- 2025/26 estimate
- 6.5
- 2026/27 estimate
- 6.5
- Government infrastructure investment (a) (b)
- Unit of measure
- $ billion
- 2021/22 actual
- 18.7
- 2022/23 revised
- 22.5
- 2023/24 budget
- 22.4
- 2024/25 estimate
- 20.6
- 2025/26 estimate
- 18.6
- 2026/27 estimate
- 16.9
- Net debt
- Unit of measure
- $ billion
- 2021/22 actual
- 100.0
- 2022/23 revised
- 116.7
- 2023/24 budget
- 135.4
- 2024/25 estimate
- 151.2
- 2025/26 estimate
- 162.2
- 2026/27 estimate
- 171.4
- Net debt to GSP (c)
- Unit of measure
- per cent
- 2021/22 actual
- 19.4
- 2022/23 revised
- 20.6
- 2023/24 budget
- 22.6
- 2024/25 estimate
- 23.9
- 2025/26 estimate
- 24.4
- 2026/27 estimate
- 24.5
Source: Department of Treasury and Finance
Notes:
(a) Includes general government net infrastructure investment and the estimated construction costs of public private partnership projects.
(b) Includes the estimated private sector construction related expenditure associated with the North East Link held in the public non-financial corporations (PNFC) sector.
(c) The ratios to gross state product (GSP) may vary from publications year to year due to revisions to the Australian Bureau of Statistics GSP data.
Victorian economic forecasts (a)(%)
| 2021/22 actual | 2022/23 forecast | 2023/24 forecast | 2024/25 forecast | 2025/26 projection | 2026/27 projection | |
|---|---|---|---|---|---|---|
| Real gross state product | 5.6 | 2.75 | 1.50 | 2.50 | 2.75 | 2.75 |
| Employment | 3.9 | 3.50 | 0.75 | 1.00 | 1.75 | 1.75 |
| Unemployment rate (b) | 4.3 | 3.75 | 4.25 | 4.50 | 4.75 | 4.75 |
| Consumer price index (c) | 4.0 | 7.00 | 4.25 | 2.75 | 2.50 | 2.50 |
| Wage price index (d) | 2.4 | 3.50 | 3.50 | 3.50 | 3.25 | 3.25 |
| Population (e) | 1.1 | 1.90 | 1.90 | 1.80 | 1.70 | 1.70 |
- Real gross state product
- 2021/22 actual
- 5.6
- 2022/23 forecast
- 2.75
- 2023/24 forecast
- 1.50
- 2024/25 forecast
- 2.50
- 2025/26 projection
- 2.75
- 2026/27 projection
- 2.75
- Employment
- 2021/22 actual
- 3.9
- 2022/23 forecast
- 3.50
- 2023/24 forecast
- 0.75
- 2024/25 forecast
- 1.00
- 2025/26 projection
- 1.75
- 2026/27 projection
- 1.75
- Unemployment rate (b)
- 2021/22 actual
- 4.3
- 2022/23 forecast
- 3.75
- 2023/24 forecast
- 4.25
- 2024/25 forecast
- 4.50
- 2025/26 projection
- 4.75
- 2026/27 projection
- 4.75
- Consumer price index (c)
- 2021/22 actual
- 4.0
- 2022/23 forecast
- 7.00
- 2023/24 forecast
- 4.25
- 2024/25 forecast
- 2.75
- 2025/26 projection
- 2.50
- 2026/27 projection
- 2.50
- Wage price index (d)
- 2021/22 actual
- 2.4
- 2022/23 forecast
- 3.50
- 2023/24 forecast
- 3.50
- 2024/25 forecast
- 3.50
- 2025/26 projection
- 3.25
- 2026/27 projection
- 3.25
- Population (e)
- 2021/22 actual
- 1.1
- 2022/23 forecast
- 1.90
- 2023/24 forecast
- 1.90
- 2024/25 forecast
- 1.80
- 2025/26 projection
- 1.70
- 2026/27 projection
- 1.70
Sources: Australian Bureau of Statistics; Department of Treasury and Finance
Notes:
(a) Percentage change in year-average terms compared with the previous year, except for the unemployment rate (see note (b)) and population (see note (e)). Forecasts are rounded to the nearest 0.25 percentage points, except for population (see note (e)).
The key assumptions underlying the economic forecasts include interest rates that broadly follow market economists’ expectations, an Australian dollar trade weighted index of 61.6, and oil prices that follow the path suggested by oil futures.
(b) Year average.
(c) Melbourne consumer price index. The Commonwealth’s CPI forecasts included in its 2023‑24 Budget are 6% over the year to June 2023 and 3.25% over the year to June 2024. Differences in magnitude between the Victorian and Commonwealth forecasts are largely presentational, mainly reflecting that growth rates in year-average terms and in over-the-year terms are not comparable.
(d) Wage price index, Victoria (based on total hourly rates of pay, excluding bonuses).
(e) Percentage change over the year to 30 June. Forecasts are rounded to the nearest 0.1 percentage point.
Reviewed 22 May 2023